9 R语言图例修改自定义教程
9.1 图例样式修改介绍
ggplot2中的图例样式修改(图例间距,位置修改等)一直是大部分用户的心头痛,因为它的修改方法实在太多了,而且很难记住。多种参数方法看起来杂乱无章,但是在24年2月更新的ggplot2 2.3.5之后,ggplot2的图例修改方法终于有了一个统一的标准。接下来我们一起学习一下吧
在ggplot2更新后有且仅有一种方式修改图例样式,那就是使用theme()参数 。theme()函数有新的参数来控制图例的外观,这使得全局控制图例的外观变得更容易。例如: theme(legend.frame)替换 guide_colourbar(frame.colour, frame.linewidth, frame.linetype) 和 theme(legend.axis.line)替换 guide_bins(axis, axis.colour, axis.linewidth, axis.arrow) 。(如果有其它方法就是还没弃置,建议不要用了)
9.4 图例行为
9.4.1 guide_legend系列
ggplot2 中的图例包含名为guide_legend(),还包括guide_colourbar() 、 guide_coloursteps()和guide_bins()基本参数都一致,设置图例的类型 。
9.4.2 更新后加了什么
下方代码展示了如何设置某单独映射的图例样式和全局样式的区别。如果要单独设置某映射的图例样式,只需将其添加到guides() 。如果要设置全局样式,只需将其添加到theme() 。最终的参数形式就是theme(legend.XXX = element_XXX()) 。
ggplot(mpg, aes(displ, hwy, shape = factor(cyl), colour = cty)) +
  geom_point() +
  # 设置单独映射的图例
  guides(
    shape  = guide_legend(theme = theme(legend.text = element_text(colour = "red"))),
    colour = guide_colorbar(theme = theme(legend.frame = element_rect(colour = "red")))
  ) +
  # 设置全局图例的样式
  theme(
    legend.title.position = "left",
    # Title justification is controlled by hjust/vjust in the element
    legend.title = element_text(angle = 90, hjust = 0.5)
  )
9.4.3 图例是否显示
唯一不放在theme里的参数就是legend.show 。您可以在图层中设置show.legend = TRUE选项。和以前一样, show.legend参数仍然可以以特定于美学的方式设置。将其设置为TRUE表示“始终显示”, FALSE表示“从不显示”, NA表示“如果找到则显示”。查看下方示例,在设置了plot的showlegend里在图例中强制显示了点和线。
p <- ggplot(mpg, aes(displ, hwy)) +
 scale_alpha_manual(values = c(0.5, 1))

p +
 geom_point(aes(colour = "points", alpha = "points")) +
 geom_line(
   aes(colour = "line", alpha = "line"),
   stat = "smooth", formula = y ~ x, method = "lm"
 )
p +
 geom_point(
   aes(colour = "points", alpha = "points"),
   show.legend = TRUE # always show
 ) +
 geom_line(
   aes(colour = "line", alpha = "line"),
   stat = "smooth", formula = y ~ x, method = "lm",
   show.legend = c(colour = NA, alpha = TRUE) # always show in alpha
 )
9.4.4 图例位置
图例位置不再仅限于图的一侧。通过设置guides的position参数,你可以定制哪些参考线出现在绘图中的位置。没有设置位置的参考线(例如下面的“drv”形状图例)遵循全局主题的legend.position设置。
p <- ggplot(mpg,
    aes(displ, hwy, shape = drv, colour = cty, size = year)) +
  geom_point(aes(alpha = cyl))+
  theme(legend.position = "left") +
  guides(
    colour = guide_colourbar(position = "right"),
    size   = guide_legend(position = "top"),
    alpha  = guide_legend(position = "inside")
  )
p
9.4.4.1 图例的对齐
图例的对齐可以通过使用theme的legend.justification.{position}参数来控制。此外,通过设置legend.location参数,可以将顶部和底部参考线与绘图而不是面板对齐。默认情况下,当plot.title.position = "plot"时,左侧图例已经对齐。因此,对于legend.location设置,顶部和底部参考线优先。
p +
  labs(title = "Plot-aligned title") +
  theme(
    legend.margin = margin(0, 0, 0, 0), # turned off for alignment
    legend.justification.top = "left",
    legend.justification.left = "top",
    legend.justification.bottom = "right",
    legend.justification.inside = c(1, 1),
    legend.location = "plot",
    plot.title.position = "plot"
  )
9.4.5 图例的间距
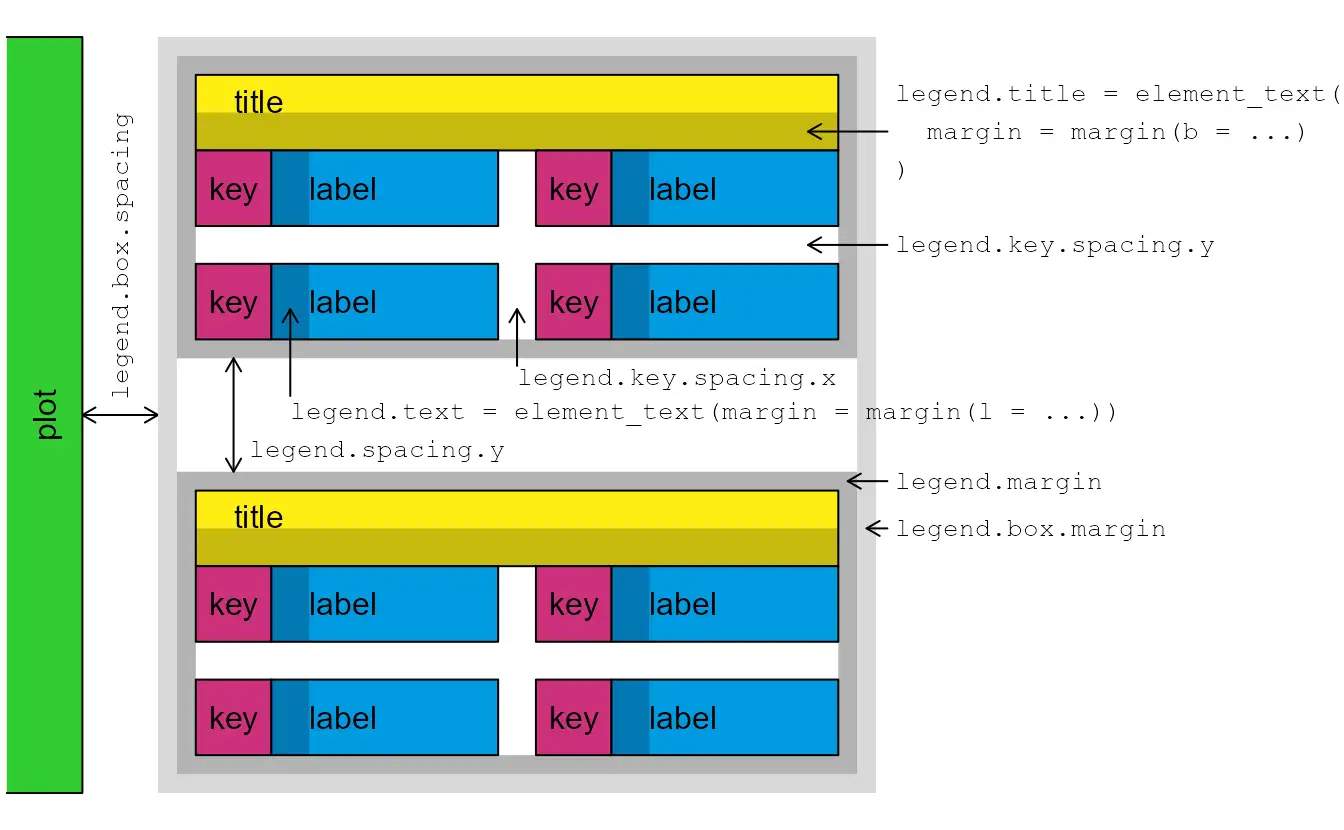
我们先观看一下下方的图,表示图例的组成和间距的含义

当标题和键没有明确的边距时,会根据文本或标题位置自动添加适当的边距。但是,如果您覆盖边距,它们将按你的设置来走。
ggplot(mpg, aes(displ, hwy, colour = class)) +
  geom_point() +
  guides(colour = guide_legend(ncol = 2)) +
  theme(
    legend.key.spacing.x = unit(10, "pt"),
    legend.key.spacing.y = unit(20, "pt"),
    legend.text = element_text(margin = margin(l = 0)),
    legend.title = element_text(margin = margin(b = 20))
  )
9.4.6 添加特殊图例
guide_custom() 。它可用于将任何图形对象(grob)添加到绘图中,例如annotation_custom() 。但有一些区别:它的位置就像图例一样,并添加了标题和页边距。从某种意义上说,本图例是“特殊的”,因为它是唯一不直接反映比例的指南。缺点是它无法从图中读取属性,但优点是它非常灵活。
x <- c(0.5, 1, 1.5, 1.2, 1.5, 1, 0.5, 0.8, 1, 1.15, 2, 1.15, 1, 0.85, 0, 0.85)
y <- c(1.5, 1.2, 1.5, 1, 0.5, 0.8, 0.5, 1, 2, 1.15, 1, 0.85, 0, 0.85, 1, 1.15)

compass_rose <- grid::polygonGrob(
  x = unit(x, "cm"), y = unit(y, "cm"), id.lengths = c(8, 8),
  gp = grid::gpar(fill = c("grey50", "grey25"), col = NA)
)

nc <- sf::st_read(system.file("shape/nc.shp", package = "sf"), quiet = TRUE)
ggplot(nc) +
  geom_sf(aes(fill = AREA)) +
  guides(custom = guide_custom(compass_rose, title = "compass"))